SaaS Waste Statistics 2026: The Enterprise AI & Tool Index
Quick Navigation ✔
Toggle50 Groundbreaking Benchmarks on Subscription Sprawl, Zombie Seats, and Token Overruns
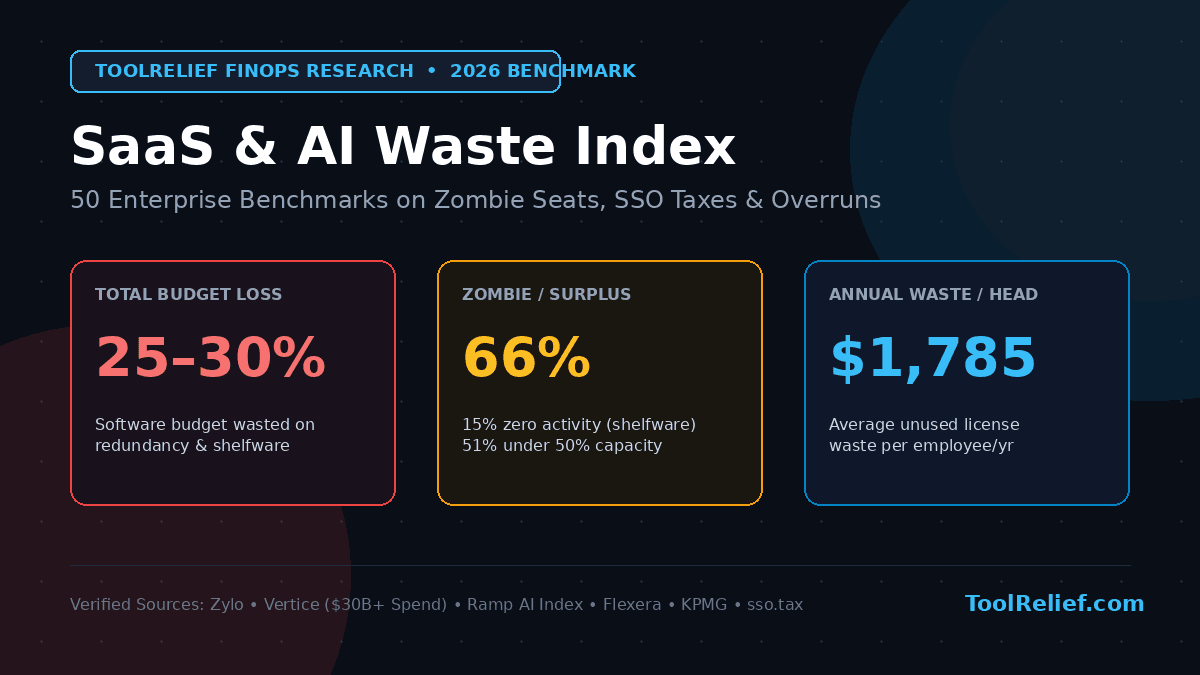
Quick Executive Summary (2026 SaaS Waste Statistics): An estimated 25% to 30% of total software budgets evaporate into unused licenses, unmonitored AI tokens, and mandatory security surcharges. Across mid-market and enterprise organizations, 66% of software licenses are either complete shelfware or severely underutilized, resulting in an average annual license waste of $1,785 per employee.
How Much SaaS Spend Is Wasted in 2026?
There is no single universal percentage that applies to every company. The strongest current benchmarks show that unused and underutilized licenses remain a major source of software waste. Zylo's 2026 data puts average annual waste from unused SaaS licenses at $19.8 million per organization, while Vertice's Q2 2026 dataset reports that 65% of SaaS licenses are either fully unused or underutilized.
What is the cost of unused software in businesses?
The cost depends on company size, seat count, contract price, and actual utilization. For large organizations, Zylo's 2026 benchmark reports an average $19.8 million in annual waste from unused SaaS licenses. For an individual company, the simplest starting calculation is: unused paid seats × annual cost per seat. ToolRelief's Unused SaaS License Cost Calculator can model that exposure using your own numbers.
Is half of SaaS spend really wasted?
Not necessarily. License utilization and the percentage of total dollars wasted are different metrics. Zylo reports that the average organization uses about 54% of its SaaS licenses, while Vertice's newer Q2 2026 analysis classifies 65% as unused or underutilized. Neither figure means that exactly half of every company's total SaaS budget is wasted. Actual financial waste depends on which licenses are idle, their contract prices, and usage patterns.
What does an unused AI license cost a company?
There is no reliable universal dollar average for an unused AI seat because AI products use different seat, credit, token, and consumption models. For fixed-seat AI subscriptions, calculate the exposure as unused seats × monthly seat price × unused months. Usage-based AI requires a separate analysis of committed credits and actual consumption. Use ToolRelief's AI Subscription Waste Calculator for a company-specific estimate.
How can companies reclaim unused SaaS licenses?
Start with actual usage rather than purchased-seat counts. Identify inactive users, reclaim or reassign licenses before buying additional seats, downgrade underused tiers, and repeat the review before renewal. Both Zylo and Vertice emphasize continuous usage monitoring as a direct way to reduce avoidable software spend.
1. Executive Summary & Key 2026 Benchmark Metrics
Three baseline numbers to open the board deck with:
| Core Metric | 2026 Benchmark | Primary Industry Source |
|---|---|---|
| Share of software budget effectively wasted | 25%–30% of total SaaS spend | Flexera State of ITAM; BetterCloud |
| Average annual license waste | $1,785 / employee / year ($19.8M enterprise avg) | Zylo 2026 SaaS Management Index |
| Zombie / Underutilized seat rate | 66% of licenses (15% shelfware + 51% underutilized) | Vertice Q1 2026 ($30B+ processed spend) |
The headline shift for 2026 isn't that companies are buying more software—portfolio sizes have flattened to roughly 305 apps per enterprise. The waste has migrated from app count to spend per app: per-employee SaaS spend jumped 21.9% year-over-year to $4,830, driven almost entirely by AI line items and aggressive price hikes at renewal. Track this shift across The ToolRelief System and evaluate your stack exposure with our SaaS Cost Benchmark Tool.
Category A: Tool Overlap & Context-Switching Costs
- The average enterprise now runs roughly 291–305 SaaS applications (240 median), up from 110 in 2020. (Zylo 2026 SaaS Management Index)
- At organizations above 10,000 employees, the average app count climbs to 447 applications. (Zylo)
- The average employee has standing access to 29 separate SaaS applications. (BetterCloud)
- Companies carry an average of 15 duplicate training tools, 11 overlapping project-management platforms, and 10 redundant collaboration apps purchased independently by different teams. (Zylo)
- Lines of business now control 70% of all SaaS spend; central IT manages just 26.1%—meaning three-quarters of your stack was never centrally vetted for overlap. (Zylo 2025/2026)
- 17% of knowledge workers switch between tabs, apps, or platforms more than 100 times in a single workday. (Vena 2026 Benchmarks)
- SaaS portfolio size has flattened (-0.07% YoY), but per-employee spend rose 21.9% YoY to $4,830. (Zylo)
- Application consolidation rates slowed from 14% of the portfolio in 2024 to just 5% in 2025. (BetterCloud 2026)
- [Modeled] At a knowledge-worker cost of ~$65/hour, 10 minutes/day lost to re-orientation across 29 apps equals roughly $2,700 per employee per year in pure context-switching drag.
- [Modeled] Consolidating overlapping categories across a 500-person company unlocks $450,000–$1.1M/year in duplicate spend recovery using modular architectures from our guide on Tools That Replace Multiple Apps.
Category B: AI Subscription Sprawl & Token Billing Overruns
- Shadow AI runs 4–9% of total enterprise software spend (6% median), typically 2–3x larger than the approved budget. (Redress Compliance, Aug 2026)
- Organizations now spend an average of $1.2 million on AI-native applications—up 108% year-over-year. (Zylo 2026)
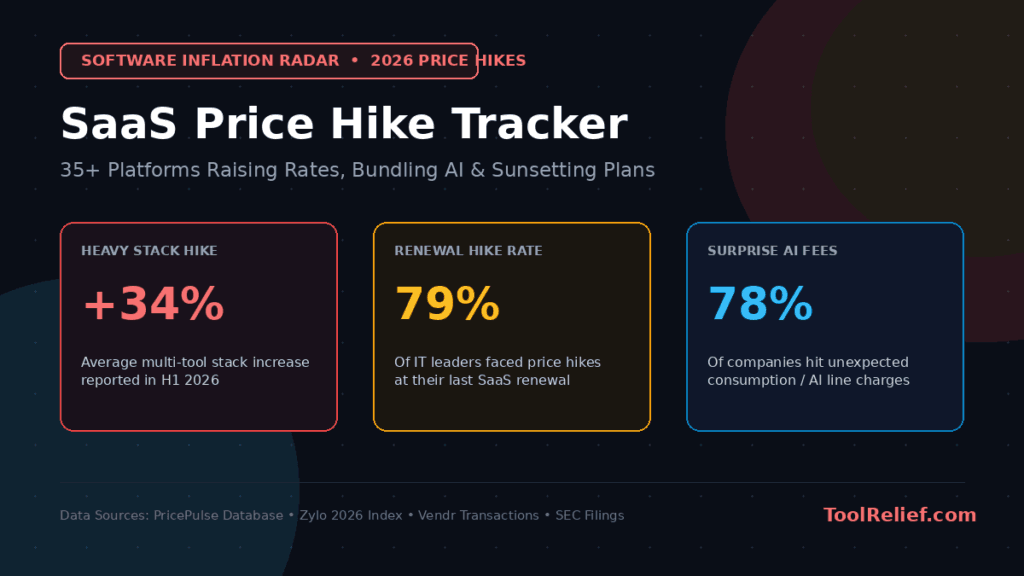
- 78% of IT leaders report unexpected charges tied to consumption-based or AI pricing models in the past year. (Zylo)
- AI spend follows an extreme power-law: the top 1% of firms spend $7,450 per employee per month on AI; the median firm spends just $11.38. (Ramp AI Index, 70k+ businesses)
- Average monthly AI token spend per company hit $140,842, but the median was only $2,246. (Ramp)
- Premium "unlimited" AI tiers (Claude Code Max, Cursor Ultra, ChatGPT Pro) have converged on the de facto $200/month anchor. (Ramp 2026)
- 79% of enterprises experienced an AI cost overrun in the past 12 months. (DoiT/Sapio Research, 500 finance leaders)
- Only 26% of large-enterprise leaders have full, real-time visibility into what their AI systems cost to run. (KPMG Q2 2026 AI Pulse)
- Two-thirds of organizations maintain an AI cost dashboard, but only 36% have direct token or usage controls. (KPMG)
- Only 21% of organizations have mature governance for agentic workloads. Calculate your team's exposure with the AI Subscription Waste Calculator and review the AI Tool Overlap Checklist.
Category C: The "SSO Tax" & Mandatory Security Upsells
- The public sso.tax catalog tracks roughly 150 enterprise vendors, with 104 carrying a computable markup for adding Single Sign-On. (sso.tax, June 2026)
- GitHub's SSO markup: moving from the base plan to SAML-enabled enterprise is a jump from $4 to $21 per user/month—a 425% premium. (sso.tax)
- Mid-range SSO markups: Figma ~275%, Notion ~88%, Slack ~72% above base list price. (Clerk Analysis)
- At the extreme end, Railway's SSO tier runs roughly 9,900% above base, and Mixpanel's markup runs 4,065%. (Clerk Analysis)
- The underlying infrastructure cost of SAML federation runs just $0.015 per monthly active user—making most SSO markups pure margin. (Trust Portal 2026)
- HubSpot's SSO-gated tier jumps from $9,600/year to $43,200/year for the same seat count—a 350% premium. (AccessOwl 2026)
- For a 100-person company running 80 SaaS tools, the true annual cost of Okta-managed SSO reaches $220,400 versus a $20,400 sticker price—a 10.8x multiplier. Review our research on SaaS SSO Tax and SSO Tax Evidence.
- 80% of SaaS applications employees use at work are not connected to an SSO portal due to tier upgrade costs.
- The U.S. CISA has formally designated SSO-as-a-paid-add-on as a security anti-pattern under "Secure by Demand" guidance. (CISA)
- Vendor accountability portals (ssotax.org) now publicly track vendors gating SAML behind 10%+ surcharges.
Category D: Inactive Licenses, Zombie Seats & Offboarding Failures
- 66% of enterprise SaaS licenses are entirely untouched or surplus to need across $30B+ in analyzed spend. (Vertice Q1 2026)
- 15% is pure shelfware (zero activity) and 51% is underutilized (under half capacity used). (Vertice)
- Only 34% of subscriptions are actively used across typical tech stacks. (Ramp)
- Average enterprise license waste sits at $19.8M annually. (Zylo 2026)
- Active governance programs improved average license utilization from 47% to 54% in 2025. Calculate your salvageable budget using our Unused SaaS License Cost Calculator.
- 89% of former employees retain access to at least one corporate app after departure. (Beyond Identity)
- 63% of ex-employees retain active, usable access to organizational data. (Wing Security 2026)
- 59% of organizations have experienced a data breach directly attributable to a former employee. (Ponemon)
- Ex-employees were found retaining access to an average of 94,000+ corporate assets post-termination. (DoControl)
- Automate your deprovisioning workflows with our Software Offboarding Checklist and the SaaS Waste Audit Tool.
Category E: Hidden Fees in Travel, Expense & Integration Middle-Tier Tools
- Global business travel spend is tracking toward $1.64 trillion in 2025/2026. (GBTA)
- Baseline T&E software runs $8–$25 per active user/month before integration fees.
- Connecting enterprise T&E platforms to ERP systems adds $10,000 to $100,000+ in custom middleware costs. Check our specialized Travel Ops architecture and the SaaS Travel Budget Waste Calculator.
- Implementation services for expense platforms typically run 20–50% of the first-year subscription cost. (Vendr 2026)
- iPaaS connector fees run thousands annually, with consumption billing carrying runaway-cost risks similar to AI tokens.
- Corporate travel invoices can disguise undisclosed airline markups as "tax" line items. (VikingOn 2026)
- Middleware connection costs for HR/Finance software rarely appear on initial vendor proposals.
- In 2026, vendors are folding AI add-ons into core tiers and sunsetting legacy non-AI plans, forcing unneeded price increases.
- Monthly billing carries a 40–60% premium over annual commitments to restrict exit flexibility.
- Across 90+ tracked SaaS tools, companies spending $84k+/yr saw an average 34% cost increase in H1 2026 alone. (PricePulse)
3. The 2026 SaaS Stack Financial Waste Equation
Total stack leakage is additive across five distinct operational buckets:
The Universal Stack Waste Equation (TSW):
TSW = (Z × Cavg) + (R × Cavg × 0.5) + AIO + SSOΔ + HF − G
- Z = Zombie licenses (0% usage shelfware cohort ≈ 15%)
- Cavg = Average annual cost per seat across the stack
- R = Underutilized licenses (<50% capacity cohort ≈ 51%, weighted at 0.5)
- AIO = AI Overrun cost =
(Actual monthly token spend − Budgeted AI spend) × 12 - SSOΔ = SSO Tax Delta = Σ across vendors of
(SSO tier price − Base price) × seats - HF = Hidden Fees (Implementation + Middleware + Monthly-billing premiums + Travel markups)
- G = Governance offset (Value reclaimed through active deprovisioning and spend caps)
Calculate your expected return on tool consolidation with our SaaS ROI Calculator or download the complete framework inside the Hidden SaaS Waste Playbook.
4. Four Real-World Scenario Breakdowns
1. Solo Agency (~$15K/yr spend)
12–18 tools, billed monthly. Main waste driver is the 40–60% monthly billing premium and forgotten trials.
Modeled Waste: $2,000–$4,000 / year (13–27% of spend)
2. 20-Person Remote Team (~$95K/yr spend)
35–50 apps with department purchasing. Redundant categories and 10.8x SSO multiplier on security tiers.
Modeled Waste: $22,000–$31,000 / year (23–33% of spend)
3. 250-Person Tech Firm (~$1.2M/yr spend)
150–200 apps, 70% spend outside IT. Zombie shelfware, AI token overruns, and multi-vendor SSO markups.
Modeled Waste: $585,000–$700,000 / year (49–58% of spend)
4. Global Enterprise (10k+ staff, ~$45M/yr spend)
447+ applications. $1.2M–$2.4M in unmonitored Shadow AI overruns plus $19.8M baseline license waste.
Modeled Waste: $22.8M–$25.7M / year (51–57% of spend)
Frequently Asked Questions (FAQ)
Are 2026 SaaS waste statistics really as high as 25%–30%?
Yes. Major audits from Flexera and Vertice (processing over $30 billion in actual software spend) confirm that 66% of software licenses are either complete shelfware or underutilized. While the number of distinct apps has stabilized, per-employee spending has surged due to automatic price increases and AI feature tiering.
Why do AI subscription costs frequently exceed corporate budgets?
Consumption-based pricing and agentic workflows burn tokens dynamically. While 66% of companies maintain AI cost dashboards, only 36% enforce hard token usage limits, causing 79% of enterprises to experience unbudgeted cost overruns.
What is the most effective single action to reduce software waste immediately?
Automating offboarding-triggered deprovisioning. With 89% of former employees retaining access to corporate applications, connecting automated license reclamation to your HRIS immediately recovers zombie licenses while eliminating severe security vulnerabilities.
Where can teams find verified discounts and multi-app alternatives?
Organizations can review verified commercial software tiers in our Global Offers Hub and the Software Offers Directory.
TOOLRELIEF DECISION INTELLIGENCE
- Decision
- Use SaaS Waste Statistics 2026: Unused Software Costs to evaluate the software or technology question investigated on this page before taking the next material action.
- Evidence Basis
- Documented product information, published evidence, comparative analysis, direct observation, and clearly labeled models where applicable.
- Best Used For
- Reducing uncertainty before taking the next material action.
- Decision Boundary
- This page provides independent decision support rather than a guaranteed outcome. Product capabilities, pricing, third-party terms, and operating conditions can change.