
SaaS Cost Benchmark Tool
Compare your monthly SaaS spending against practical benchmark ranges and
see whether your team may be overspending on software subscriptions.
This tool helps founders, operators, finance teams, and software buyers estimate whether their SaaS spend is reasonable
for their team size and industry — or whether it may be time to run a deeper SaaS waste audit.
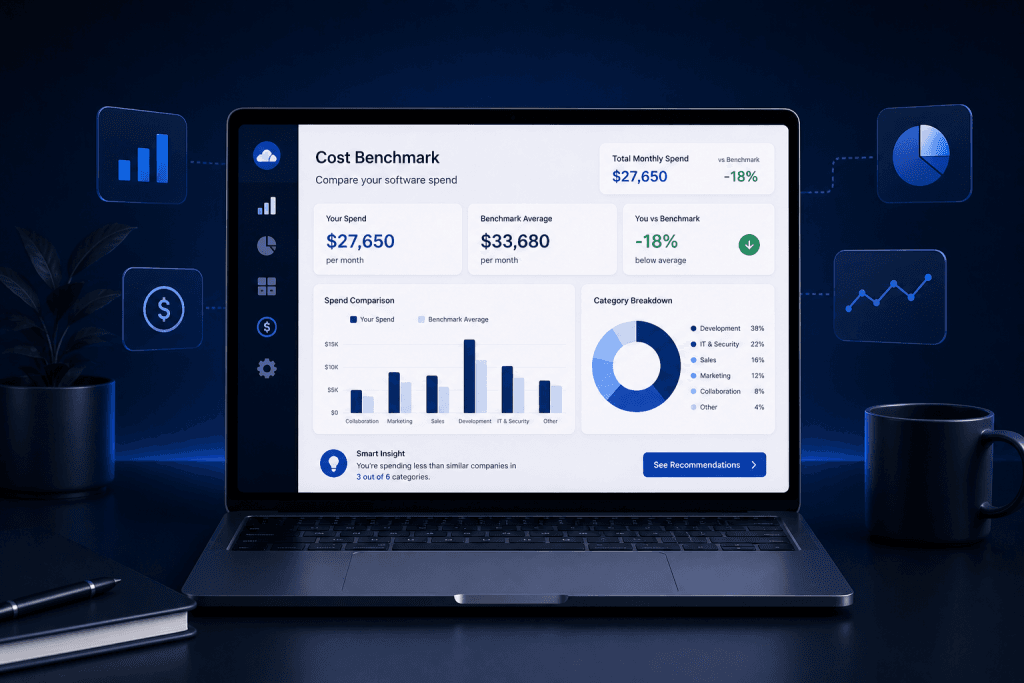
Compare Your SaaS Spend
Your Benchmark Result
How to Use This SaaS Cost Benchmark
Use this benchmark as a starting point, not as a final financial decision.
Enter the number of people on your team, your estimated monthly SaaS spend,
and the industry that best matches your business.
The tool will help you understand whether your current software spend appears low, reasonable,
elevated, or potentially excessive compared with a practical benchmark range.
For best results, include recurring SaaS subscriptions such as project management tools,
CRM platforms, analytics tools, AI tools, design software, communication apps, cloud-based productivity tools,
and other monthly or annual software services.
Practical SaaS Spend Benchmarks
SaaS spending varies by company size, industry, workflow complexity, and the number of paid seats.
The ranges below are practical reference points to help you interpret your results.
Monthly SaaS Spend per User | Interpretation | What It May Mean |
|---|---|---|
Under $50 | Lean | Your stack may be simple, early-stage, or highly controlled. |
$50–$150 | Normal | Common range for many small teams using core productivity and operations tools. |
$150–$300 | Elevated | May be reasonable for software-heavy teams, but worth reviewing for overlap. |
$300+ | High | Strong signal to check unused seats, duplicate tools, and renewal risk. |
Example SaaS Spend Scenarios
Here are a few simple examples to help you understand how to read the benchmark result.
What This Benchmark Can and Cannot Tell You
This benchmark gives you a practical reference point for reviewing your software spend.
It helps you compare your SaaS cost against a simple baseline using signals like team size, estimated spend, tool count, and stack complexity.
Use the result as a starting point, not a final verdict.
A benchmark can help you notice when your software spend looks unusually heavy, but it cannot tell you by itself which tools are essential, which seats are inactive, or which renewals are risky.
For that, you need to review the actual stack: owners, seats, usage, contracts, and renewal timing.
If the benchmark suggests your costs are high, the next step is to build a SaaS inventory, estimate unused license waste, and review renewal risk before making cuts.
Example 1: A 10-Person Marketing Team Spending $1,200/Month
This equals $120 per user per month. For many small marketing teams,
this may be within a normal range if the stack includes email marketing, analytics,
design, project management, communication, and AI writing tools.
However, the team should still check for overlapping subscriptions, unused seats,
and tools that duplicate features already included in larger platforms.
Example 2: A 25-Person SaaS Company Spending $8,000/Month
This equals $320 per user per month.
That is a high software cost and may be justified only if the company relies heavily on engineering,
analytics, customer support, CRM, cloud, security, and product tools.
At this level, the company should review vendor overlap, seat utilization, annual renewal dates,
and whether multiple teams are paying for similar tools separately.
Example 3: A 5-Person Startup Spending $2,500/Month
This equals $500 per user per month. For a small startup,
this is usually a warning sign unless the business depends on specialized software or infrastructure.
The most common causes are unused AI tools, duplicate project management apps,
overlapping analytics platforms, multiple design subscriptions, and software bought during experiments but never cancelled.
What to Do If Your SaaS Spend Looks High
If your SaaS spending appears higher than expected, do not cancel tools randomly.
Start with a structured review.
First, list every recurring software subscription.
Then identify who owns each tool, how many seats are paid for, how often the tool is used,
and whether another tool already provides the same function.
High SaaS spend is often caused by tool overlap, unused seats, annual renewals, duplicate AI subscriptions,
and software that was tested once but never removed from the budget.
Review all monthly and annual SaaS subscriptions.
Check whether paid seats are actively used.
Identify duplicate tools across teams.
Look for AI tools that overlap with existing software.
Review upcoming renewal dates.
Cancel or downgrade tools only after confirming ownership and usage.
Go Deeper With ToolRelief SaaS Tools
The benchmark tool gives you a quick signal.
For a deeper review, use the related ToolRelief calculators and audit resources below.
Before comparing your SaaS spend against benchmarks, calculate your SaaS Waste Score to see whether unused seats,
duplicate tools, or renewals are inflating the number.
Important Limitations
This SaaS Cost Benchmark Tool provides an educational estimate only.
It does not replace a full financial review, procurement audit, accounting review, or professional advisory process.
SaaS costs vary widely depending on team size, industry, contract terms, seat usage, security requirements,
infrastructure needs, and the maturity of your company.
Use the result as a signal to investigate your software stack more carefully, not as a final decision by itself.
Frequently Asked Questions
What is a SaaS cost benchmark?
A SaaS cost benchmark is a reference range that helps you compare your software spending against a practical estimate for your team size or business type. It helps identify whether your current spend looks lean, normal, elevated, or potentially excessive.
How do I calculate SaaS spend per user?
Divide your total monthly SaaS spend by the number of active team members. For example, if your company spends $3,000 per month on SaaS tools and has 20 team members, your SaaS spend is $150 per user per month.
What should I include in monthly SaaS spend?
Include recurring software subscriptions such as CRM tools, project management software, communication tools, AI tools, design software, analytics platforms, productivity apps, cloud-based tools, and other paid digital services used by your team.
Is high SaaS spend always bad?
No. Some teams need expensive software because of engineering, security, compliance, customer support, analytics, or infrastructure needs. High spend becomes a problem when it comes from unused seats, duplicate tools, unclear ownership, or subscriptions that no longer support real work.
What is the fastest way to reduce SaaS waste?
The fastest first step is to identify unused seats, duplicate tools, and subscriptions with upcoming renewal dates. After that, review whether multiple teams are paying for tools that solve the same problem.
Quick Answer
The SaaS Cost Benchmark Tool compares your SaaS spending with industry benchmarks to show if your team is overspending.
Final Takeaway
The SaaS Cost Benchmark Tool compares your SaaS spending with industry benchmarks to show if your team is overspending.
Learn more about SaaS cost optimization in our blog.
Written by Waleed Al-Qasem
Founder of ToolRelief.
I write about the intersection of technology, remote work, and human productivity.
My mission is to help teams eliminate digital noise and get back to doing deep, meaningful work.
Founder of Nexio Global and ToolRelief. I write about SaaS costs, AI tool overload, and practical ways to build simpler, more efficient workflows. After spending over $47K on SaaS tools and experiencing tool overlap firsthand, I now help teams make clearer software decisions with less noise. Read my full story →
If your workflow feels heavier with AI…
You don’t need another tool.
You need less.
Explore ToolRelief to simplify your stack and regain control.